Reading Time: 10 minutes
The €47 Million Question
Barcelona’s city council faced a crisis in 2015. After investing €47 million in smart city infrastructure, council members demanded proof: “How much social value are we getting for every euro spent?”
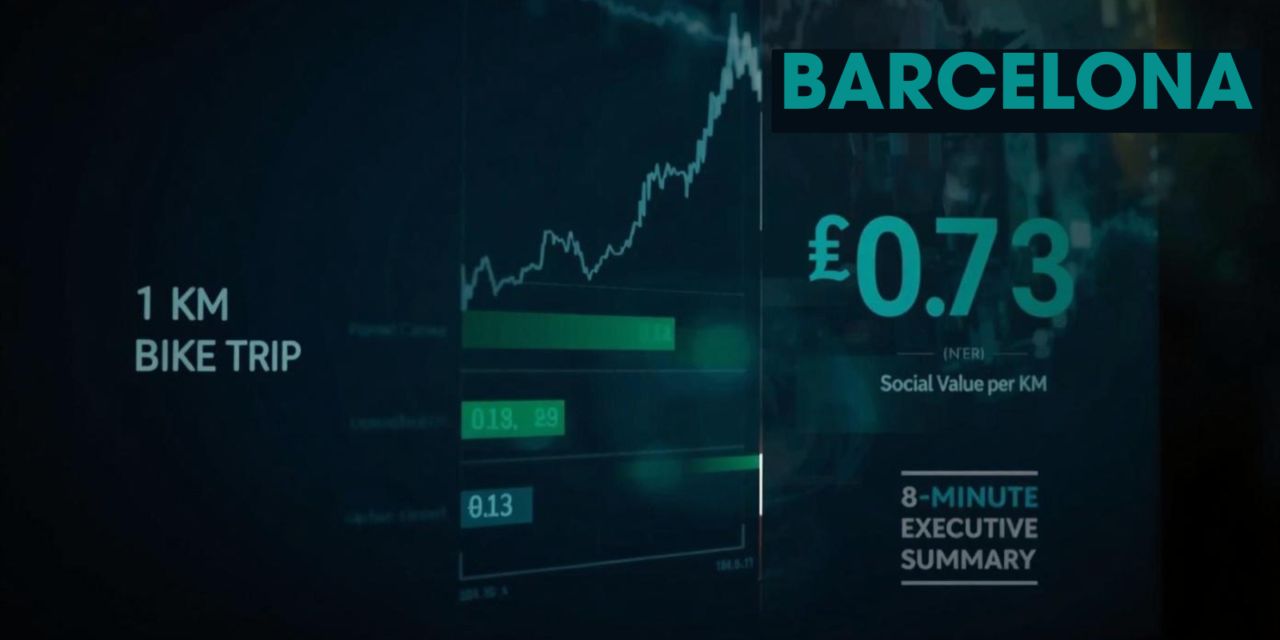
The answer: For every kilometer a Barcelona resident bikes instead of drives, the city generates €0.73 in social value. This includes healthcare savings (€0.42), avoided congestion (€0.18), and carbon reductions (€0.13). Across 100,000 Bicing subscribers, this delivers €47 million in annual social value from a program that appeared to “lose” €13.5 million by simple accounting.
This is Social Return on Investment (SROI). Barcelona used it to validate €92 million in infrastructure savings, create 47,000 technology jobs, and achieve a verified 2.39:1 socioeconomic return on its technology parks.
Yet most cities attempting SROI fail. They drown in data complexity, inflate results with optimistic proxies, or face political backlash when stakeholders dispute monetary valuations of social outcomes.
This executive summary answers three questions:
- When should your city invest in SROI versus simpler metrics?
- What makes Barcelona’s approach credible when others failed?
- How do you avoid the implementation failures that waste time and budget?
SROI in 60 Seconds: What It Actually Measures
Traditional return on investment (ROI) works for revenue-generating projects. Install solar panels, reduce energy costs, calculate payback period.
But urban quality-of-life interventions resist simple financial accounting. How do you quantify healthcare savings when residents bike instead of drive? Economic productivity preserved when congestion decreases? Social cohesion value when neighborhoods become walkable?
SROI provides methodology to translate social, environmental, and community benefits into monetary terms that budget committees can evaluate alongside traditional infrastructure investments.
The Core Formula:
SROI Ratio = Present Value of Benefits (after adjustments) ÷ Total Investment
The challenge isn’t the formula. It’s selecting financial proxies that stakeholders trust and auditors can verify.
Barcelona’s Three-Step Process:
- Identify outcomes: What changes because of the intervention? (More cycling, less driving, improved air quality)
- Assign financial proxies: What is each outcome worth? (Healthcare cost savings per cycling trip, productivity loss per hour of traffic delay)
- Apply reality filters: What would have happened anyway? (15% deadweight: some would bike regardless. 40% attribution: other policies also affect outcomes.)
Barcelona spent eight months developing its proxy library before calculating its first SROI ratio. Cities that skip this foundation produce inflated results that fail external verification.
The Three Case Studies That Proved SROI Value
Case 1: Bicing Bike-Sharing — €0.73 Social Surplus Per Kilometer
The Challenge: Bicing’s €18 million operating budget exceeds €4.5 million subscription revenue by €13.5 million annually. By simple accounting, the program “loses money.” Council questioned whether to continue funding.
The SROI Analysis:
Barcelona assigned monetary values to four benefit categories:
| Benefit | Proxy Source | Value per km | Annual Total |
|---|---|---|---|
| Healthcare savings | Catalan regional healthcare system costs | €0.42 | €8.5M |
| Congestion avoidance | OECD urban productivity data | €0.18 | €3.6M |
| Carbon reduction | EU emissions trading market price | €0.13 | €2.5M |
| Total Verified | €0.73 | €14.6M |
After conservative adjustments (15% deadweight, attribution discounts), the program generates 2.99:1 SROI ratio. Every euro of subsidy creates €3 in social value.
The Political Outcome: Barcelona expanded Bicing from 6,000 to 7,000 bikes based on this analysis.
Case 2: Superblocks — 2.47:1 Return on Pedestrian Zones
The Investment: €3.4 million over five years to convert car intersections into pedestrian zones with 10 km/h speed limits.
The Controversial Benefit: Barcelona attempted to monetize “social capital formation” (community events, volunteer time, local commerce increase) at €590K annually. City council conservatives objected: “You cannot put a price on community engagement.”
Barcelona’s Solution: Created two-tier reporting:
- Tier 1 (Verified): Space reclamation value, health gains, accident reduction = 2.47:1 SROI
- Tier 2 (Aspirational): Social capital benefits reported separately, not claimed in official ratio
This conservative approach maintained stakeholder trust while acknowledging benefits beyond verified calculations.
The “Resilience Premium”: During COVID-19 lockdowns, superblock neighborhoods showed 31% higher compliance with outdoor exercise guidelines. Residents trusted the safety of their pedestrian zones, enabling healthy behavior. Barcelona cannot monetize this “resilience” but tracks it as additional unmeasured value.
Case 3: Smart Lighting — Compound ROI at 3.03:1
The Original Business Case: €42 million investment, 30% energy savings, five-year payback.
What SROI Revealed:
| Benefit Stream | Annual Value | Order Effect |
|---|---|---|
| Energy reduction | €10.5M | First-order (direct) |
| Maintenance savings | €4.0M | Second-order (efficiency) |
| Accident avoidance | €467K | Third-order (externality) |
| Total | €15.0M | Compound effect |
Simple business case captured first-order benefits and stopped. SROI methodology revealed cascading effects that tripled the calculated value.
Key Insight: Cities using only first-order calculations systematically undervalue infrastructure investments delivering substantial social benefits.
The Decision Framework: Is SROI Worth €400K Annual Investment?
Barcelona’s full SROI program costs €400,000 annually (2.5 FTE staff, external verification, consultant support). This investment delivers 230:1 ROI through validated savings and political support for continued smart city funding.
But SROI is not appropriate for every city.
When SROI Makes Strategic Sense:
Condition 1: High-Stakes Political Environment
- Budget scrutiny from council or public is intense
- Controversial interventions require robust justification (road closures, parking elimination)
- Competing for limited capital against other departments
Condition 2: Data Infrastructure Maturity
- Real-time sensor networks providing granular data
- Integrated city data platforms connecting disparate systems
- Staff capability for statistical analysis
- Minimum threshold: ISO 37120 Bronze certification or equivalent
Condition 3: Portfolio of Social Interventions
- Projects with significant non-financial benefits (health, environment, social cohesion)
- Multi-year initiatives requiring long-term benefit tracking
- Programs serving equity goals where financial ROI is secondary
When SROI Is Premature:
Scenario 1: Cities lacking foundational data infrastructure should invest in sensor networks and data platforms first, pursue SROI in 2-3 years.
Scenario 2: Projects with clear financial returns (energy efficiency with simple payback) don’t benefit from SROI complexity.
Scenario 3: Short-term pilots (under 2 years) don’t provide sufficient observation period for social impact measurement.
Scenario 4: Politically stable environments with low scrutiny may not justify €400K SROI investment.
Quick Self-Assessment:
Score yourself (1-5 on each question):
- Does your budget face intense council/public scrutiny?
- Can you produce automated monthly utility reports from digital meters?
- Do you have controversial interventions requiring justification?
- Can your staff perform statistical analysis (regression, causal inference)?
- Do you manage multiple projects with significant social benefits?
Scoring:
- 20-25 points: Strong SROI candidate
- 12-19 points: Start with 2-3 pilot projects using simplified methodology
- Below 12 points: Focus on data infrastructure first, use traditional cost-benefit analysis
The Five Failure Modes That Kill SROI
Failure 1: Proxy Inflation
Amsterdam’s Mistake (2012-2014): Used national healthcare costs (€2,100 per treatment) rather than regional costs (€1,480), inflating cycling SROI by 42% to achieve 4.8:1 ratio.
WCCD Audit Result: Rejected. Amsterdam spent 14 months recalculating, delaying €40 million in planned investments.
Lesson: Use the most granular, verifiable proxy available even if it lowers SROI. Regional data is always more credible than national averages.
Failure 2: Ignoring Deadweight
Mid-Sized European City: Claimed 22% air quality improvement from smart lighting. External analysis revealed 18 percentage points came from regional industrial decline, 2% from favorable weather, only 2% from lighting reduction. The 11:1 over-claiming destroyed stakeholder trust.
Lesson: Always establish baseline trends. Conservative attribution (15-25% deadweight) is safer than aggressive claiming.
Failure 3: Attribution Gaming (Double-Counting)
Singapore (2013-2015): Transportation Authority and Environment Agency both claimed full credit for CO₂ reductions from metro expansion in separate SROI calculations. Total claimed reduction exceeded actual improvement by 180%.
Fix: “Single attribution rule”—each outcome assigned to one primary intervention only.
Failure 4: Data Collection Burden
Anonymous US City (2014-2016): Attempted SROI across 47 projects requiring 890 monthly data points. After 18 months and €420,000 in consultant fees: poor data quality, zero verified ratios, abandoned initiative.
Barcelona’s Solution: Focus on 12 core proxies with highest impact and data quality. Start with 1-2 projects before scaling citywide.
Failure 5: Political Backlash on Monetization
Barcelona’s Response to Volunteer Time Controversy:
- Transparent communication—published methodology for stakeholder feedback
- Two-tier reporting—separated verified from aspirational benefits
- Conservative attribution—applied 40% adjustment signaling city not claiming full credit
- Relative framing—compared intervention costs rather than valuing people’s time absolutely
Result: Stakeholder trust maintained through methodological boundaries acknowledgment.
The Verification That Makes SROI Credible
Barcelona’s SROI withstands political scrutiny because of ISO 37120 certification. This international standard for city data requires:
- Standardized metrics: 104 indicators using exact calculation formulas
- Verifiable data sources: Sensor readings, administrative records, census data
- Annual external audits: World Council on City Data (WCCD) verification
- Public transparency: Results published for peer review
Verification Cost vs. Value:
- Annual ISO 37120 audit: €45,000 (0.05% of smart city budget)
- Value delivered: €92M validated savings, political support for €200M continued investment, bond rating maintenance
The €45K audit expense is insurance against the costly failures that derailed Amsterdam (€40M investment delay) and Singapore (political credibility loss).
Alternatives for Smaller Cities:
- ISO 37120 Bronze: Only 46 core indicators, €15K-€25K annually
- Academic Partnership: University-verified methodology, €5K-€10K annually
- Peer City Collaboration: Joint external auditor, €10K-€15K per city
Three Strategic Lessons from Barcelona
Lesson 1: SROI Is Not Universal
Barcelona invested €400K annually because €200M+ in spending decisions depended on robust justification. Cities without intense political scrutiny, mature data infrastructure, and social intervention portfolios should use simpler metrics first.
The decision is clear: Pursue SROI when political environment demands rigorous proof, data systems enable credible analysis, and project portfolio includes significant non-financial benefits. Otherwise, the investment delivers minimal return.
Lesson 2: Credibility Requires Conservative Assumptions
Amsterdam’s aggressive proxies destroyed credibility, causing 14-month delays. Barcelona’s 40% attribution adjustments and two-tier reporting maintained stakeholder trust even when proxies generated controversy.
Three credibility principles:
- Use the most granular proxy available (regional over national)
- Apply aggressive adjustment factors (create buffer room)
- Engage external auditors from the start (not just final checkpoint)
Cities that inflate SROI gain short-term political wins but lose long-term analytical credibility. The damage is not recoverable.
Lesson 3: SROI Reveals Hidden Value Traditional Accounting Misses
Simple accounting showed Bicing “lost €13.5M annually.” SROI revealed €3 in social value per euro invested.
Smart lighting business case showed 30% energy savings. SROI captured maintenance efficiency, accident reduction, and safety improvements, tripling calculated value.
The pattern: Traditional accounting captures first-order effects and stops. SROI identifies cascading benefits across multiple order effects that significantly increase total value.
Your Implementation Roadmap
Month 1: Readiness Assessment
- Complete self-assessment questionnaire
- Inventory existing data systems and gaps
- Identify executive champion with budget authority
- Calculate preliminary ROI estimate
Decision Point: If scoring below 12 points, pause SROI and invest in foundational data infrastructure first.
Months 2-4: Pilot Project Setup
- Select 2-3 flagship projects with robust data
- Establish cross-departmental steering committee
- Engage external verification partner (ISO 37120 or academic)
- Develop initial proxy library
Budget Allocation:
- Staff time: 1.0 FTE for pilot phase
- Consultant support: €25K-€50K
- Verification: €15K-€25K
- Total pilot investment: €100K-€150K
Months 5-12: Pilot Implementation
- Collect baseline data (minimum 12 months required)
- Calculate preliminary SROI ratios
- Test proxy selection and adjustment factors
- Conduct internal peer review
Common Pilot Duration: 14 months (Barcelona’s timeline for Bicing/lighting)
Months 13-18: Verification and Scaling
- External audit of pilot calculations
- Refine methodology based on feedback
- Scale to additional projects if pilot succeeds
- Establish ongoing reporting cadence
Scale Decision Point: Only expand if pilot achieves verified SROI >1.5:1 and stakeholder acceptance.
The Bottom Line
Barcelona proved social value is measurable when cities commit to methodological rigor and transparent assumptions. The city’s €0.73 per kilometer from bike-sharing, 2.47:1 from superblocks, and 3.03:1 from smart lighting demonstrate that “intangible” benefits can be quantified credibly.
Three takeaways for municipal leaders:
- SROI is a tool, not a truth. Use it when political environment demands proof, data infrastructure enables credibility, and benefits resist simple financial accounting. Skip it when conditions don’t align.
- Conservative assumptions build long-term trust. Amsterdam’s inflated proxies caused 14-month delays and €40M postponements. Barcelona’s two-tier reporting and aggressive adjustments maintained credibility through controversy.
- SROI reveals value traditional metrics miss. Cities using only first-order calculations systematically undervalue social investments. Cascading benefits (maintenance efficiency, accident reduction, economic spillovers) often double or triple initial business case projections.
The strategic question: Is your city ready to invest €400K annually to validate €200M in spending decisions? If yes, Barcelona’s framework provides the roadmap. If no, focus on foundational data systems and revisit SROI when conditions align.
Next Steps:
- Complete self-assessment using the questionnaire in Section 4
- Calculate ROI of SROI based on your city’s bond issuance and political scrutiny level
- Contact Barcelona City Management for methodology templates and proxy libraries
- Engage verification partner before starting calculations, not after
Resources:
- Barcelona Digital City Plan: https://ajuntament.barcelona.cat/digital/en
- ISO 37120 Certification: https://www.dataforcities.org
- SROI Network Standards: https://www.socialvalueuk.org
Reading Time: 10 minutes | Full Report: 8,600 words available for comprehensive methodology details, calculation breakdowns, and failure recovery strategies.