New York City converted 7,500 obsolete payphones into smart kiosks in 2016. By 2026, the LinkNYC project will have generated over $500 million in revenue while providing free Wi-Fi, phone calls, and device charging to millions of residents. The city didn’t pay a dollar upfront. Instead, a private consortium funded the infrastructure in exchange for advertising rights and anonymized user data.
This is the new math of smart cities. The question is no longer “Can we afford this technology?” but “Can we afford not to measure its returns properly?”
For decades, municipalities treated smart city investments like traditional infrastructure—roads, bridges, water systems—where benefits are assumed but rarely quantified beyond basic cost savings. That approach failed because it ignored the compound returns that only emerge when you measure three dimensions simultaneously: financial savings, economic competitiveness, and social well-being.
In 2026, the ROI framework has matured. Leading cities no longer guess at benefits or rely on vendor promises. They use standardized methodologies, real-time data dashboards, and social impact accounting to turn every smart city project into an evidence-based investment decision.
Here’s the complete framework for measuring smart city success in 2026:
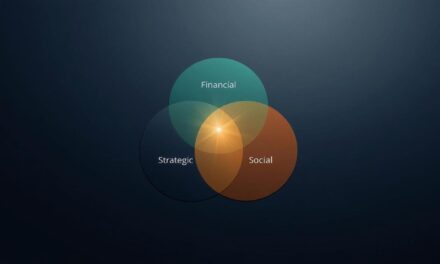
The Triple Bottom Line: Three ROI Dimensions That Matter
The most sophisticated cities now evaluate every technology project across three dimensions simultaneously. A project that excels in one dimension but fails in another doesn’t get funded. This integrated approach prevents the most common failure mode: deploying technology that saves money but excludes vulnerable populations or generates operational savings while harming the environment.
1. Financial ROI: Making Technology Pay for Itself
The most immediate success metric is the ability to pay for infrastructure through operational savings. In 2026, leading cities use a “refinancing through savings” model where reduced costs from smart systems amortize the initial capital investment.
How It Works:
Predictive maintenance systems reduce emergency infrastructure failures by 70 to 85% compared to reactive approaches. Traditional municipal maintenance involves 25 to 35% emergency repairs that cost four to six times more than planned maintenance, according to the American Public Works Association. Smart IoT sensors identify problems weeks before they become crises.
Columbus, Ohio invested $12 million in acoustic leak detection sensors for its water network in 2023. The system prevented 847 leaks in the first year, saving $7.2 million annually through reduced emergency repairs and avoided main breaks. Payback period: 18 months. Ten-year net present value: $58 million.
Milwaukee took this concept further by establishing a Smart City Revolving Fund. Annual operational savings of $7.3 million from predictive maintenance and energy efficiency now service bonds worth $45 million, funding continuous infrastructure upgrades without taxpayer budget allocations.
→ Learn the complete refinancing model with detailed financial formulas and case studies
2. Economic ROI: The Productivity Multiplier
Smart cities create economic benefits that don’t appear directly on municipal ledgers but significantly boost the local tax base and business competitiveness. These “quasi-tangible” returns are increasingly quantified and incorporated into investment decisions.
Measuring the Impact:
Adaptive traffic management systems like Pittsburgh’s SURTRAC reduce commute times by 15 to 20%, cut vehicle idling by 25%, and decrease emissions by 21%. The economic translation: The Texas A&M Transportation Institute calculates that the average American loses 54 hours per year to traffic congestion, costing $1,377 in wasted time and fuel.
For a city of one million with 600,000 commuters, a 15% reduction in commute time returns 4.8 million hours annually. At a median hourly wage of $28, that represents $134 million in economic value flowing to businesses through longer effective workdays and to workers through reduced stress and fuel costs.
Corporate site selection increasingly factors in smart city capabilities. Analysis of Fortune 500 headquarters relocations between 2020 and 2025 shows cities that improved their IMD Smart City Index ranking by 15 points or more saw headquarters relocations increase by 23% compared to cities with flat or declining scores.
Austin, Texas improved its global SCI ranking from 47th in 2020 to 18th in 2025. During the same period, Austin attracted 14 major corporate headquarters relocations. Commercial property tax revenue increased 67%, far outpacing the 12% cost of the smart infrastructure that enabled it.
→ See the complete economic impact analysis with productivity calculations and corporate relocation data
3. Social ROI: Quantifying the Intangible
The most critical evolution in 2026 is the adoption of Social Return on Investment (SROI) frameworks. This methodology assigns monetary proxies to social and environmental outcomes that were previously dismissed as “intangible.” Bond investors, sustainability-linked loan providers, and multilateral development banks now require SROI reporting for infrastructure financing.
The SROI Framework:
SROI differs from traditional ROI by measuring value created for all stakeholders, not just financial returns to the investor. A smart city project might generate modest direct revenue but create substantial value through reduced crime, improved health outcomes, or increased social cohesion.
Barcelona’s Parc de la Ciutadella smart upgrade demonstrates the methodology. The city invested €2.5 million in IoT sensors for adaptive lighting, safety cameras, environmental monitors, and WiFi coverage. Over 24 months, the project generated:
- €100,800 annually in avoided juvenile justice costs (37% increase in youth program participation)
- €60,000 annually in avoided policing costs (18% reduction in property crimes)
- €78,000 annually in increased sales tax revenue (22% increase in small business foot traffic)
- €890,000 over five years in health benefits (64% increase in park usage, improved mental health outcomes)
Total social value over five years: €4.8 million. Investment: €2.5 million. SROI ratio: 1.92:1.
This analysis secured €15 million in green bonds for citywide park upgrades, with the SROI framework built into ongoing performance monitoring.
→ See the complete SROI calculation methodology with step-by-step Barcelona case study
Global Standards: The Credibility Framework
Proprietary metrics are being abandoned. Investors and citizens demand standardized measurements that enable cross-city comparison and third-party verification. The shift to international standards signals investment readiness and unlocks access to infrastructure capital markets.
The ISO 37100 Series
The International Organization for Standardization developed a suite of standards specifically for sustainable and smart cities. These are rigorous specifications that require third-party auditing and certification:
ISO 37120 defines 100 indicators across 19 themes including economy, education, energy, environment, health, housing, safety, and transportation. Cities report annually and are benchmarked against peers.
ISO 37122 adds 80 indicators measuring digital infrastructure, open data initiatives, e-government services, and ICT deployment. It measures both availability and actual usage.
ISO 37123 covers disaster preparedness, climate adaptation, and system redundancy—critical for cities facing flood risk, heat waves, and supply chain disruptions.
Achieving ISO 37120 certification takes 12 to 18 months on average. The process begins with a gap analysis, followed by data collection system implementation, a full year of compliant data gathering, and external audit. Zurich completed the journey in 14 months. Singapore took 16 months. Seoul required 19 months.
The payoff extends beyond credibility. The European Investment Bank offers 0.25% interest rate reductions for ISO 37120 certified cities. Over a $100 million bond issuance, that reduction saves $2.5 million in interest costs.
→ Get the complete ISO certification roadmap with timeline, costs, and requirements
The Integrated Success Model: Making It Work
True ROI emerges when cities combine all three dimensions in a reinforcing cycle. This requires a decision framework that prevents single-dimensional optimization.
The Information Economics Scorecard
Leading cities use an Information Economics (IE) framework to prioritize projects when dozens of opportunities compete for limited resources. The IE scorecard evaluates projects across three dimensions simultaneously:
- Financial returns (40%): Direct operational savings and revenue generation
- Strategic impact (30%): Economic competitiveness, talent attraction, business environment
- Social equity (30%): Inclusive benefits, housing accessibility, service quality for underserved populations
Projects must score at least 7 out of 10 on each dimension to receive funding. A traffic system that scores 9 on financial returns and 8 on economic impact but only 4 on social equity gets rejected.
Amsterdam’s transport authority used this framework to evaluate 23 potential smart mobility projects in 2024. The highest financial ROI project was dynamic pricing for downtown parking, projected to generate €8.9 million annually. But it scored only 3 on social equity because it would disproportionately burden low-income drivers. The project was rejected.
The funded project was an integrated mobility platform connecting transit, bikeshare, and subsidized ride-hailing for first/last mile connections. Financial score: 6. Economic impact: 8. Social equity: 9. The platform reduced car dependency by 11% and increased transit ridership by 18%, with the strongest growth among populations previously underserved by fixed-route transit.
→ Learn the complete IE Scorecard methodology with scoring templates and decision matrices
The Compounding Returns Cycle
Smart infrastructure creates a self-reinforcing cycle when measured and managed properly:
Phase 1: Deploy technology that generates operational savings (predictive maintenance, energy efficiency, process automation).
Phase 2: Use operational savings to establish a revolving fund that services bonds for next-wave projects.
Phase 3: New projects improve economic competitiveness, attracting businesses that grow the tax base.
Phase 4: Increased tax revenue funds social programs and inclusive services, building political support for continued investment.
Phase 5: Improved quality of life and reduced inequality attract talent and residents, further growing the economic base.
This cycle only works if social equity is measured and prioritized from day one. Cities that skip the equity component create a different cycle: technology concentrates in wealthy neighborhoods, raises property values, displaces long-term residents, generates political backlash, and leads to program cancellations.
Milwaukee’s success worked because the city council required that each technology wave include explicit benefits for the city’s poorest neighborhoods. Smart streetlights went into high-crime areas first. Predictive maintenance started with water systems serving the oldest housing stock. The result was sustained political support across five election cycles.
What Success Looks Like in 2026
A decade ago, successful smart cities meant installing technology and hoping it worked. ROI was speculative. Vendors made promises that were rarely tracked. Citizens had no visibility into whether their tax dollars created value.
In 2026, success means hitting quantified targets across financial, economic, and social dimensions simultaneously. ROI is measured in real-time with dashboards that any resident can access. Projects are funded based on projected SROI ratios that must be validated within 18 months or funding is redirected.
The sophistication gap between leaders and laggards has widened. Cities with mature measurement frameworks are deploying their fifth or sixth wave of smart infrastructure, funded through compounding operational savings. Cities still debating whether to invest in smart meters are a decade behind and falling further back.
Common Mistakes That Kill ROI
Despite mature frameworks and proven methodologies, cities still make predictable mistakes:
Measuring inputs instead of outcomes. Counting sensors deployed tells you nothing about value created. The relevant question is not “How many sensors do we have?” but “How much did we reduce costs or improve services?”
Ignoring social impact until political backlash emerges. Technology projects that concentrate benefits among already-privileged populations generate opposition that can take years to surface. By the time protests shut down a smart district development, millions have been spent on infrastructure that cannot expand.
Single-dimension ROI. Optimizing for financial returns alone leads to projects like facial recognition networks that save money on policing but create surveillance states. Optimizing for environmental returns alone leads to bike infrastructure that gentrifies neighborhoods.
Vendor-driven metrics. Technology companies define success in ways that favor their products. Cities must define success criteria before engaging vendors, not accept vendor-provided frameworks.
→ See the complete analysis of smart city failures with recovery strategies
The Path Forward
Cities that master this triple measurement framework unlock something more valuable than any single project: the ability to turn each success into funding for continuous improvement. Predictive maintenance savings finance better transit. Energy savings fund affordable housing sensors. Data revenue supports digital literacy programs.
This integrated vision separates cosmetic “smart city” branding from genuine urban transformation. For the municipal leader in 2026, ROI is not an accounting exercise. It’s the bridge between a technology procurement and a generation of compounding community benefits.
The framework requires commitment:
- Establish baseline measurements across all three ROI dimensions before deploying technology
- Implement real-time dashboards that track progress against targets and are accessible to residents
- Require SROI analysis for all projects over $1 million
- Pursue ISO 37120 certification to signal investment readiness and enable peer benchmarking
- Use the IE Scorecard for project prioritization to prevent single-dimensional optimization
- Build political consensus by ensuring every technology wave includes explicit benefits for underserved populations
The question is no longer whether your city can afford to be smart. It’s whether you can afford to measure success the old way.
Key Takeaways
✓ Smart city ROI must be measured across three dimensions: financial savings, economic competitiveness, and social well-being
✓ The refinancing-through-savings model allows cities to fund continuous improvements without annual budget allocations
✓ SROI frameworks assign monetary values to social outcomes, making “intangible” benefits quantifiable for investment decisions
✓ ISO 37120 certification unlocks green bond markets and reduces borrowing costs by 0.25% or more
✓ The IE Scorecard prevents single-dimensional optimization by requiring minimum scores across all three ROI dimensions
✓ Cities with mature measurement frameworks are deploying their fifth or sixth wave of infrastructure funded through operational savings
✓ The sophistication gap between leaders and laggards is widening—cities without robust measurement frameworks are falling a decade behind